The Histogram is a picture of a list of numbersIt looks like the following example How to read histograms:The AREAS of the blocks represent PERCENTAGESEXAMPLE: Final scores in a class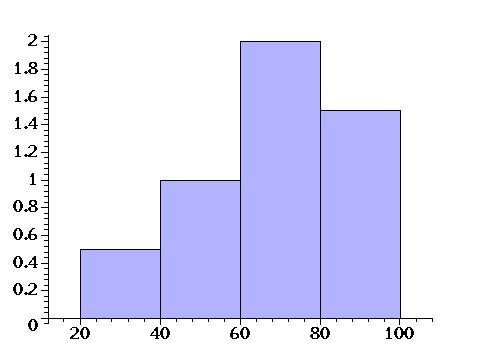 About 10% scored between 20 and 40What percentage scored over 40?What % scored between 50 and 70?About what % scored between 70 and 75?Answers |