The Correlation Coefficient and the SD line
> with(stats):
> x := [1,2,3,4,5,6,7]:
> describe[mean](x):
> AVE := x -> stats[describe,mean](x):
> AVE(x);
4
> SD := x -> stats[describe,standarddeviation](x):
> SD(x);
2
> y := [6,7,5,4,3,1,2]:
y := [6, 7, 5, 4, 3, 1, 2]
> AVE(y);
4
> SD(y);
2
> r := (x,y) -> stats[describe,linearcorrelation](x,y):
-13
---
14
> with(statplots):
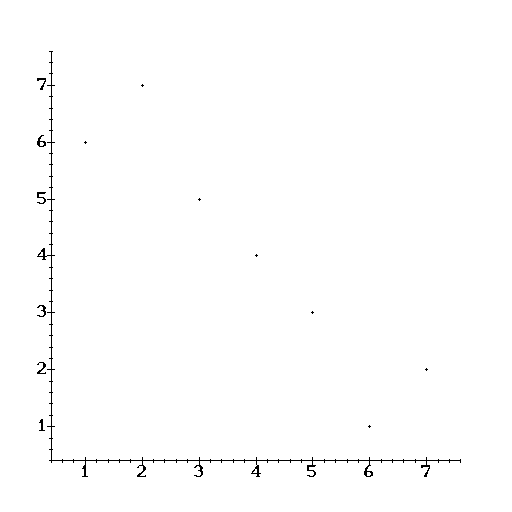
> scatter := (x,y) -> stats[statplots,scatter2d](x,y):
> scatter(x,y);
> sdline := (x,d1,d2) -> AVE(d2)+sign(r(d1,d2))*(SD(d2)/SD(d1))*(x-AVE(d1)):
> with(plots):
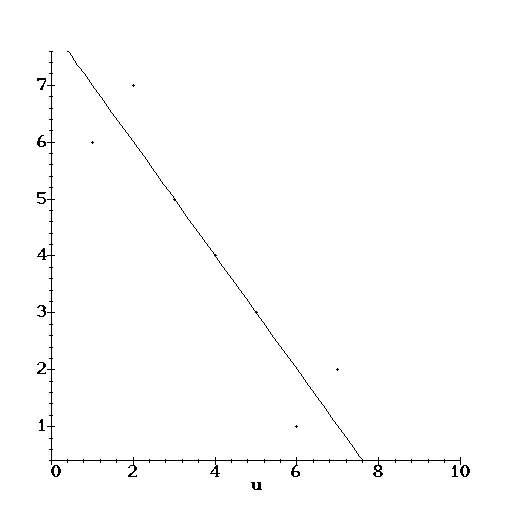
> l1 := plot(sdline(u,x,y),u=0..10):
> scat := scatter(x,y):
> display({l1,scat});
|
Compute the five number summary for the following data: x as before and y given by,
|
> yb := [2,1,4,3,7,5,6]:
> avex := AVE(x): sdx := SD(x): avey := AVE(yb): sdy := SD(yb): rb := r(x,yb):
> avex, sdx, avey, sdy, rb;
23
4, 2, 4, 2, ----
28
> evalf(rb);
.8214285714
> l2 := plot(sdline(u,x,yb),u=0..10):
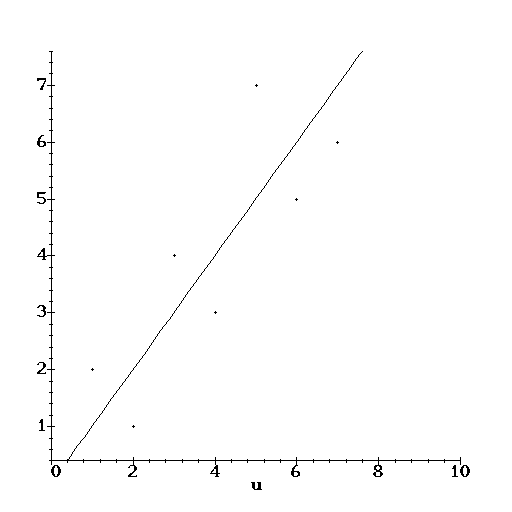
> scat2 := scatter(x,yb):
> display({l2,scat2});
Link to the commands in this file
Carlos Rodriguez <carlos@math.albany.edu>
Last modified: Thu Feb 19 14:17:47 EST 1998